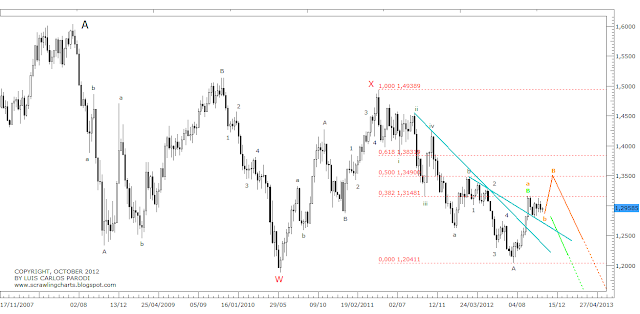
The EUR/USD has remained in corrective mode since 2008 trying to find out support for the whole impulse begun at 2000. Using the Elliott Wave Principle (EWP) we could make an approach to know what is going on with this pair. As a corrective mode EWP tells us that the correction could finish in a WXY pattern and we can look at the chart that the market is performing wave b of Y that means an ABC correction where wave b does not confirmed if it is complete or not. So to complete the ABC correction also we need a wave c and that means more lower and our first target for that is the area between the support of the last wave 4 that is 1.1640 and the 0,618 fibonacci level at 1.1220.
Also the RSI (13) indicator is below the 50 line so it confirms that the market is still bearish.
 |
EUR/USD MONTHLY CHART
|
At the weekly chart, we could see with more details what is happen with wave B. Look at B could be in place because the market corrected the wave A to 0,382 fibonacci level that is perfect to continue the down trend toward our target (green line). The problem is that this is not confirmed. The weekly RSI (13) is still bullish, so we most wait to change to bearish to confirm that wave B is ended.
The other probability is that the market could go higher in a ABC correction. That is we are performing wave b and we need to go higher to complete the correction before go lower (orange line). If the market want to go higher, the first target should the last high around 1.3170 and then 0,500 fibonacci level at 1.3490.

No hay comentarios:
Publicar un comentario